06.08.2019
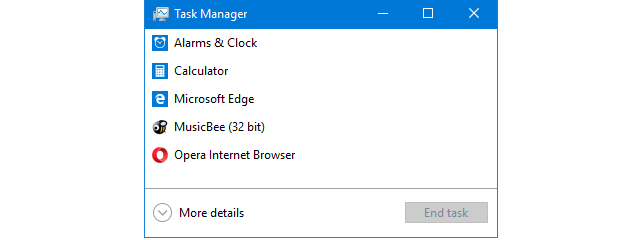
Have you ever wanted to know how much of your processor's power is being used at a particular time? Or maybe how much free RAM was left for your favorite game to use? How about how much of your video card's power is used? All these are essential system resources without which apps and games cannot run well. If you want to see statistics as well as real-time information, you should know that the Windows Task Manager allows the user to monitor the current processor (CPU) and memory utilization, check the video card (GPU) usage, as well as other system resources. Here's how to keep tabs on your system resources:
NOTE: This guide is created for Windows 10 and Windows 8.1, and some of the features we show are available only in the latest versions of Windows 10.
Where to find the tools that let you monitor the system resources: access the Task Manager's Performance tab
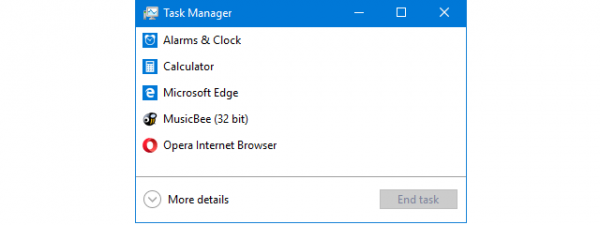
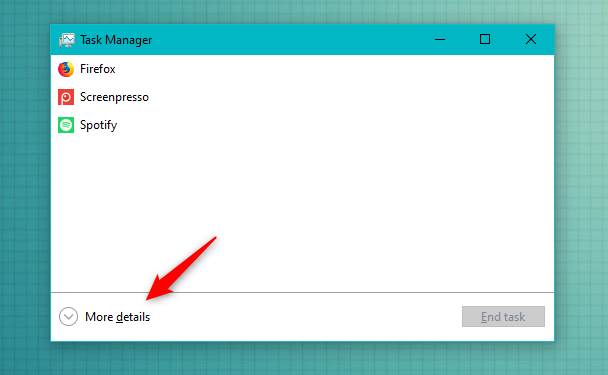
To get a look at resource consumption, you must launch the Task Manager. While there are many methods to do that, for speed and ease we recommend using the keyboard shortcut "Ctrl + Shift + Esc." If the Task Manager opens in its compact view, click or tap on "More Details" to expand to full view.
Then, click or tap on the Performance tab. It should look more or less like in the screenshot below. Its looks and contents depend on the version of Windows that you use and on the hardware you have.
Let's see how to use the Performance tab from Task Manager to monitor the performance of the essential hardware components such as your CPU, GPU, and memory utilization.
1. Task Manager allows the user to monitor the current processor utilization
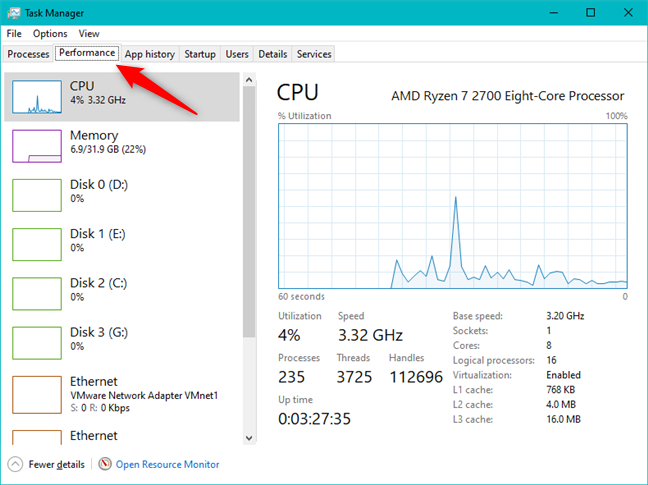
By default, the Performance tab of Task Manager first shows you the usage of CPU, otherwise known as the processor. If it is not already selected, you can do so manually by clicking or tapping on CPU on the left side of the window.
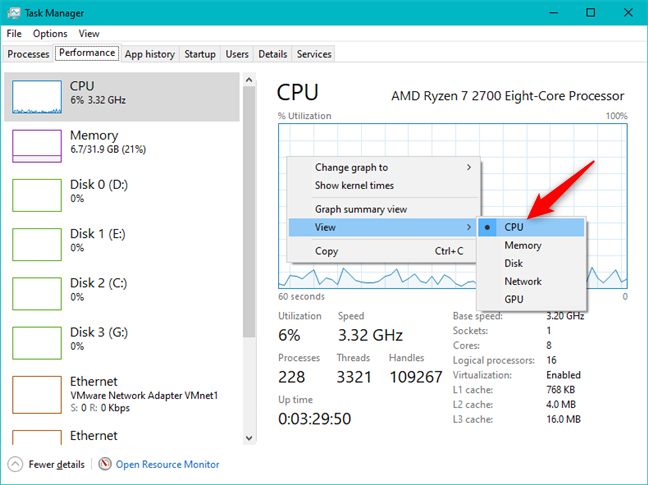
You can also choose to view the CPU usage by right-clicking anywhere inside the window and choosing "View -> CPU."
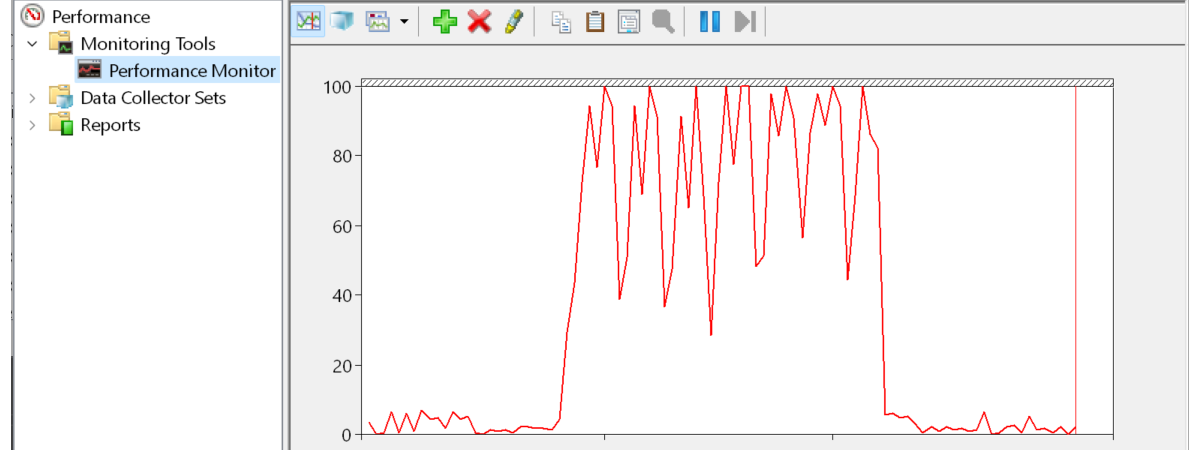
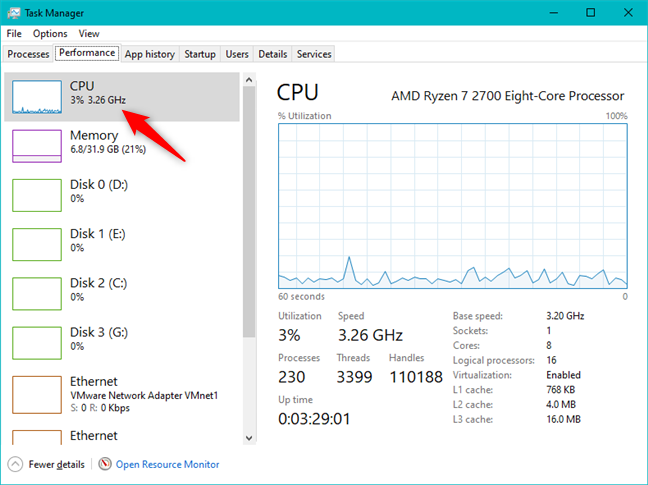
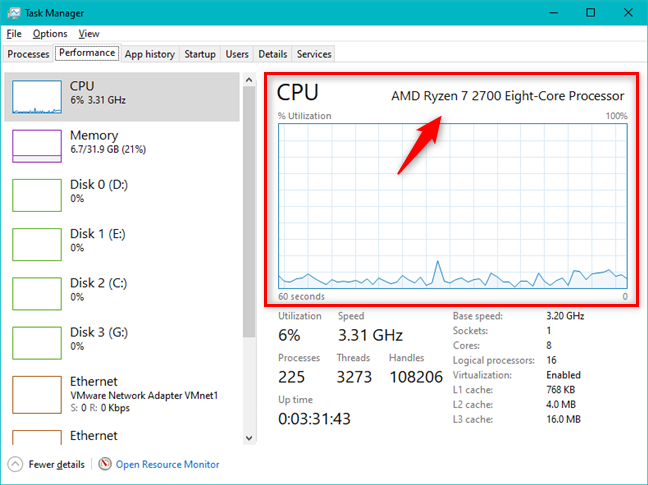
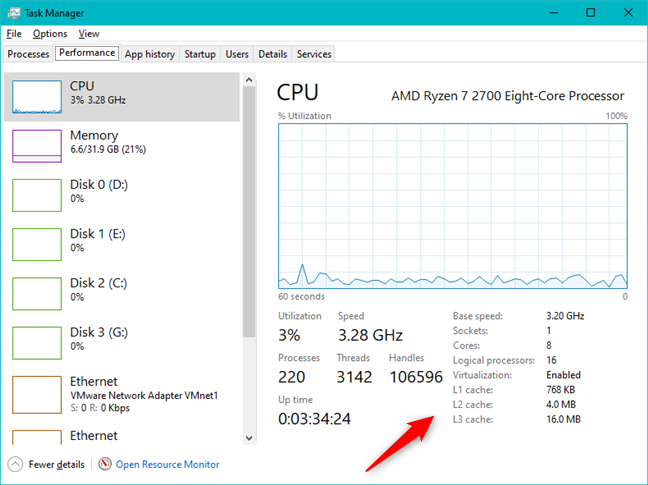
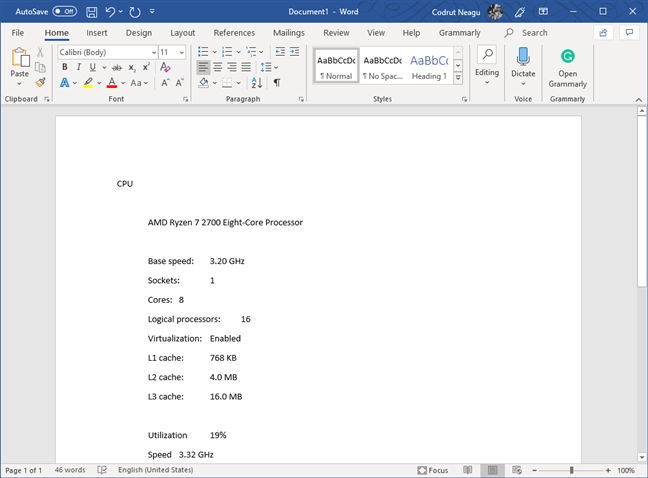
Once you have selected the processor, on the right side of the window, you should see a graph that shows the percentage of the CPU usage during the last 60 seconds. Notice that in the upper right corner of the resource view, Task Manager shows you the exact model of your processor.
Below the graph, there is detailed information about the current CPU utilization and speed, as well as information about your processor's specifications such as its Base speed, number of Sockets and Cores, Logical processors (threads), whether the Virtualization feature is on or off, and the amounts of Level 1, 2, and 3 cache memory available on it.
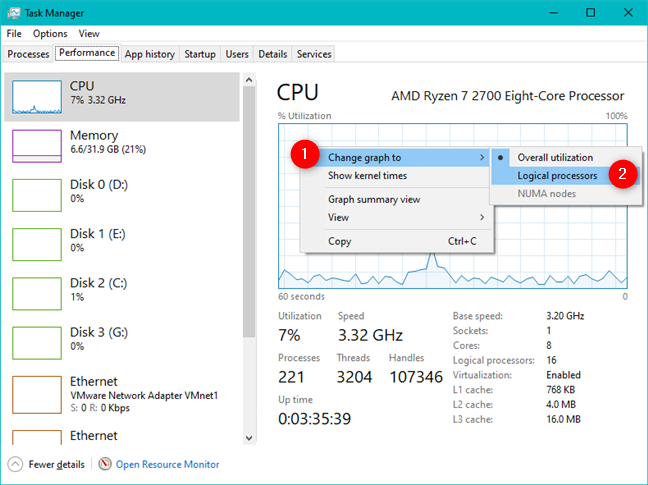
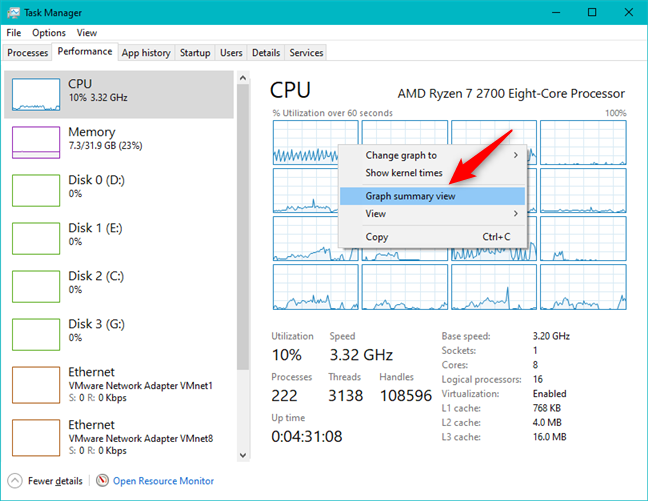
By default, you get a graph for each physical processor in your PC. It makes sense, but it may not be what some users are looking for: to get a more detailed picture of your processor usage, you can split the graph into logical processors. Right-click or press-and-hold on the CPU graph, hover over "Change graph to" and then click or tap on "Logical processors."
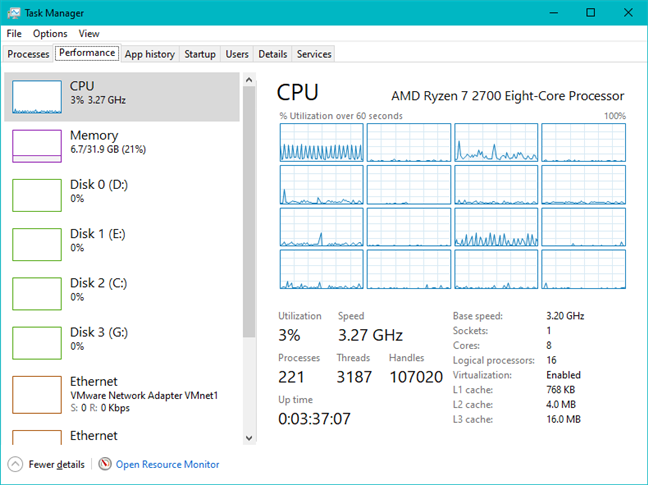
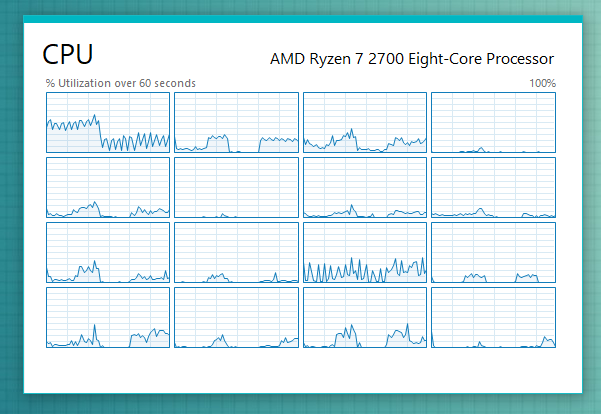
You should now see smaller graphs for each of the CPU's logical processors. For our AMD Ryzen 7 2700 processor, we get 16 charts, one for each of its threads. You may see more or less, depending on your computer's processor.
If you want to see even more information about how CPU cycles are being allotted, you might want to consider showing kernel times. They show how many of your CPU cycles are being used by the kernel, which is responsible for internal system functions, and how much is getting used by user processes.
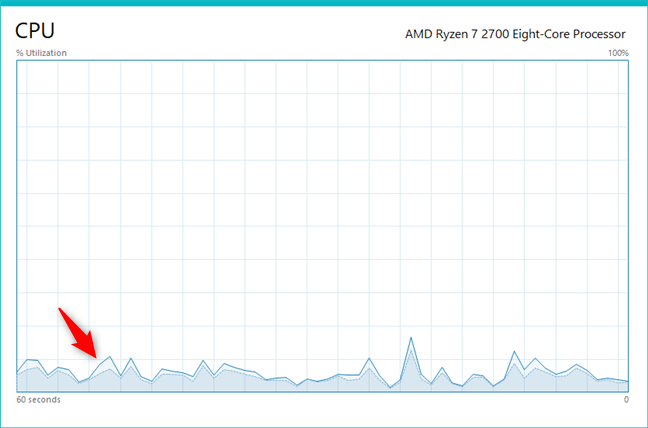
To enable kernel times, right-click or press-and-hold the CPU graph and click or tap "Show kernel times."
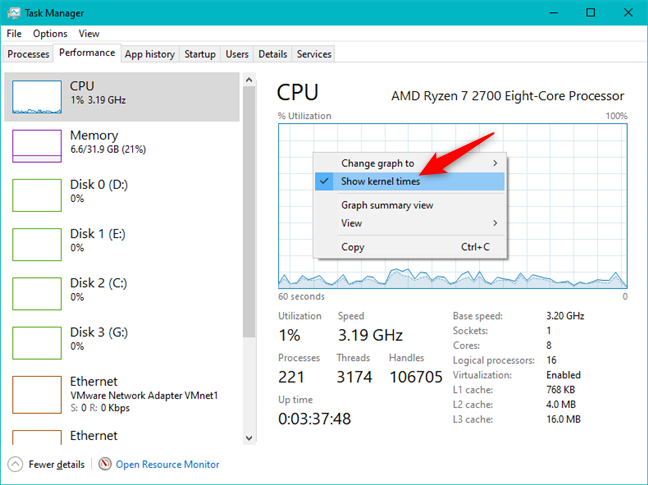
The darker areas of the graph represent kernel time, while the lighter areas represent other types of usage.
2. Task Manager allows the user to monitor the current memory utilization (RAM)
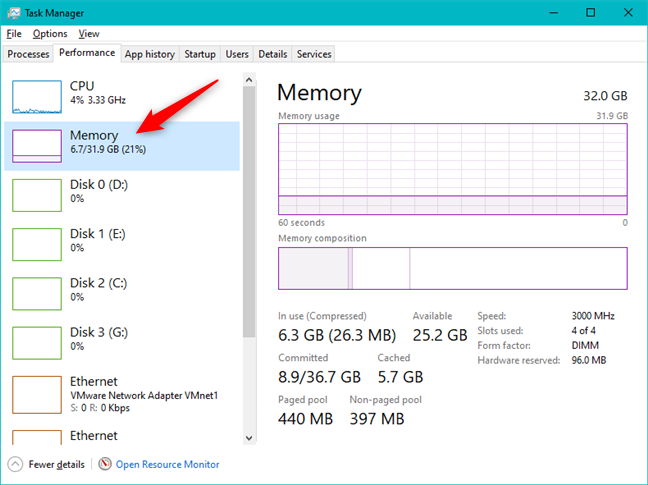
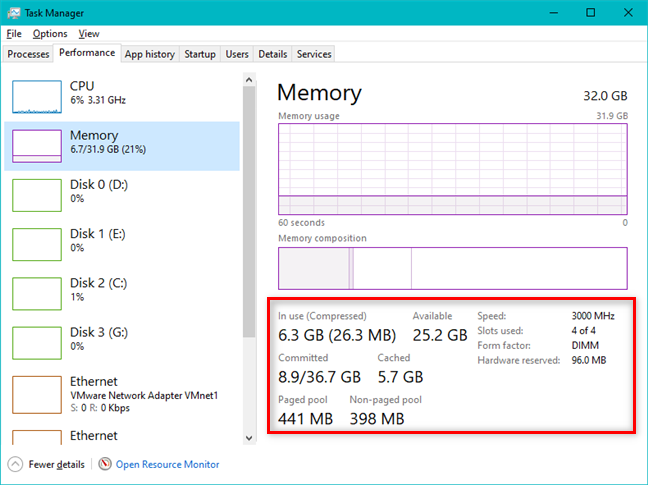
Another resource that you probably want to keep a close eye on, especially during slowdowns, is your RAM (Random Access Memory). You can view memory usage by choosing Memory from the list of resources on the left side of the Performance tab.
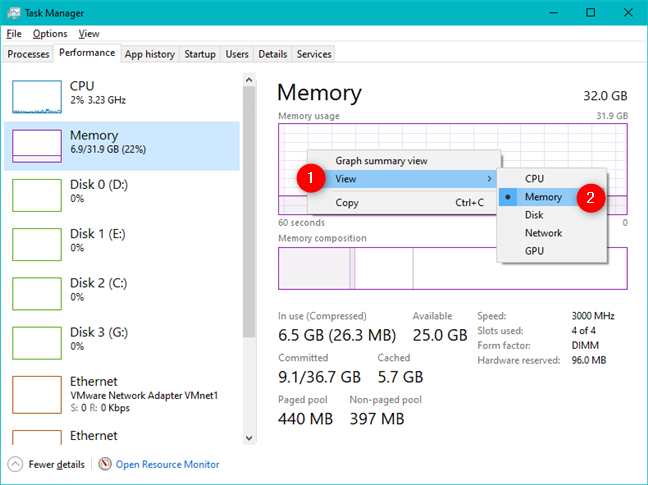
To switch to the Memory graph, you can also right-click or press-and-hold anywhere inside the window and go to "View -> Memory."
The Memory section displays two graphs. The top graph displays the percentage of memory used during the last minute. The lower graph shows how memory is allocated. Hover your mouse over each section of the lower graph to see what is what.
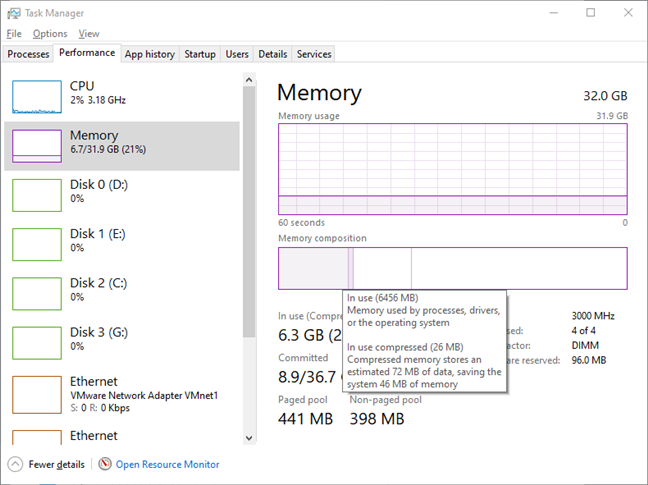
The RAM usage is split into four usage types:
- In Use - Memory currently being used by apps, drivers, or Windows itself.
- Modified - Memory whose contents must be written to disk before it can be used for other purposes.
- Standby - Memory that contains cached data and code that is not currently in use.
- Free - Memory that is not currently in use and free for use.
Below the graphs, there's more detailed information about the RAM, including used memory, available memory, its speed, slots used and form factor, paged and nonpaged memory pool size, and so on. The pools of memory that you see are either guaranteed to reside in physical memory or can be swapped back and forth to the disk, as needed. You should also see the total memory used for cache and the total committed memory. The amount of data displayed also depends on your computer's hardware configuration.
3. Task Manager allows the user to monitor the current video card utilization (GPU)
In the last versions of Windows, including the May 2019 Update and Fall Creators Update, the Task Manager also lets you check GPU usage. This feature is not present in older versions of Windows 10, nor older versions of Windows.
You can monitor the performance of all your graphics cards by selecting them from the list on the left of the Task Manager window. If you have more than one video card installed on your device, you should have an entry for each of them.
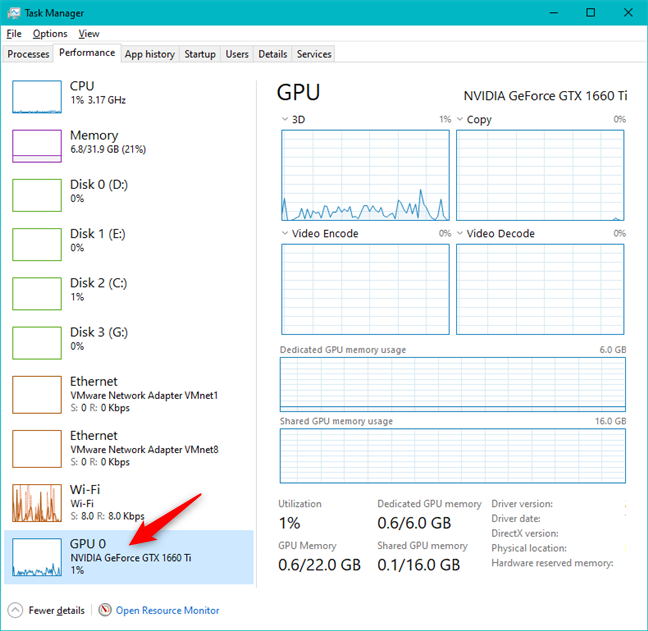
When you select a video card that you want to monitor, the right side of the window fills up with graphs and information about its activity. Depending on the type of video card you select, you should see graphs for how much of its power is spent on 3D, Copy, Video Encode, and Video Decode.
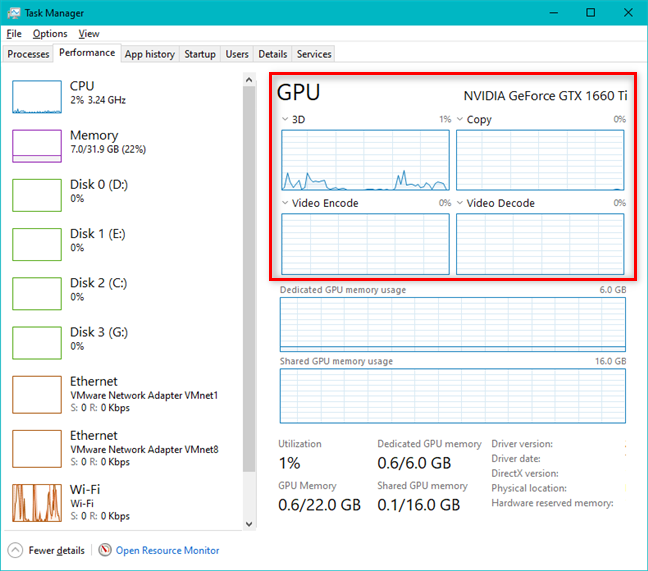
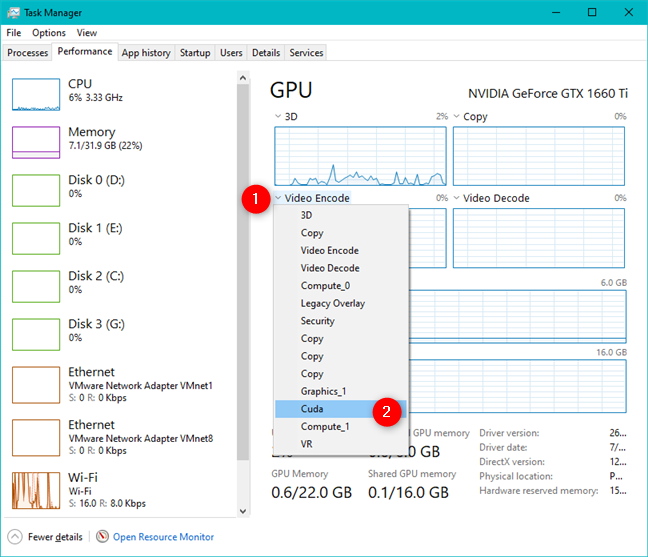
By default, the Task Manager has enough room to display only four different graphs. However, if you want to change one of them and monitor some other feature, you can click or tap on the small arrow button on the top-left corner of a graph and select what to watch. You can choose from things like Video Processing, Legacy Overlay, Security, Cuda, VR, and so on, depending on the actual features offered by that video card.
Under the four feature graphs, the Task Manager also shows how the video memory is used. You should have a graph for the "Shared GPU memory usage" and, if your video card also has dedicated memory, you should also have one called "Dedicated GPU memory usage." On the top-right corner of each graph, you can find out the total amount of video memory available on your system.
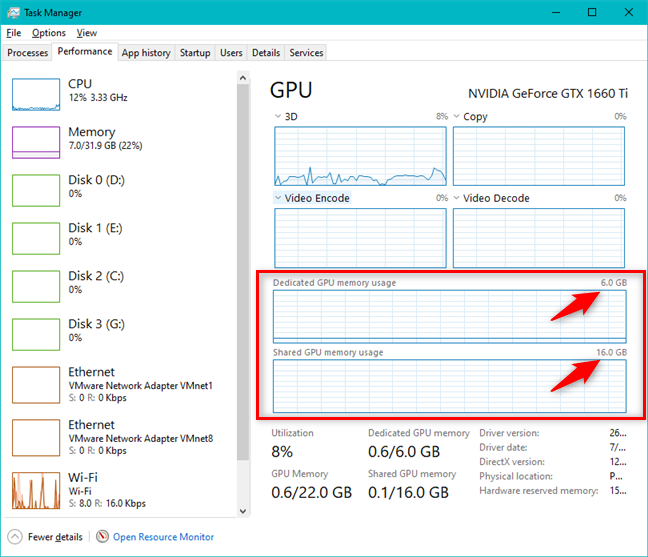
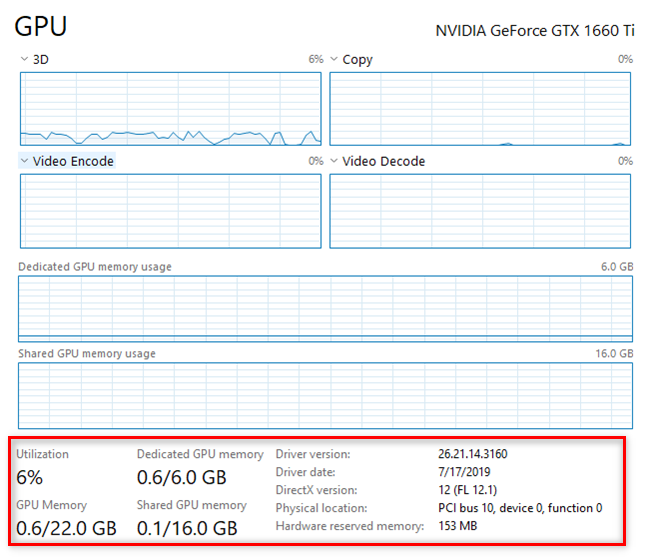
Below the graphs, there's plenty of other useful information. You can see the total Utilization percentage of your video card, the amount of GPU Memory used and the amount available, as well as the Dedicated GPU memory, and the Shared GPU memory used and the amounts available. There are also details about the driver version used, the driver date, DirectX version, the amount of Hardware reserved memory, if any, and the Physical location, which shows you the PCI bus to which the video card is connected inside your computer.
4. Task Manager allows the user to monitor the current network utilization (Wi-Fi, Ethernet, Bluetooth)
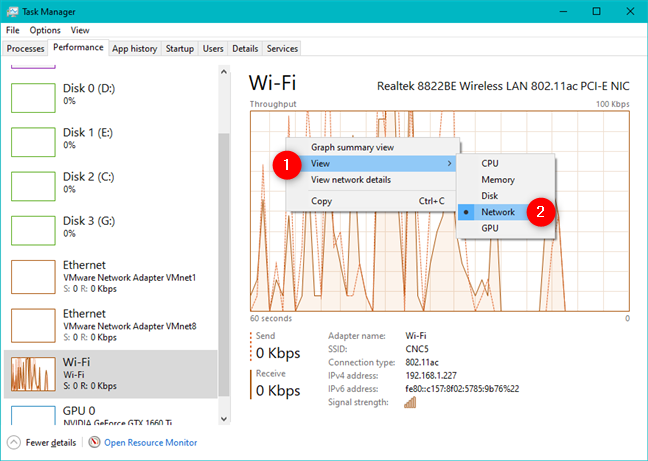
To monitor your network usage, first, select which of your network interfaces you want to monitor. You can do that from the resource list on the left side of the Task Manager Performance tab. If you prefer, you can also right-click or press-and-hold anywhere in the Performance tab and choose "View -> Network."
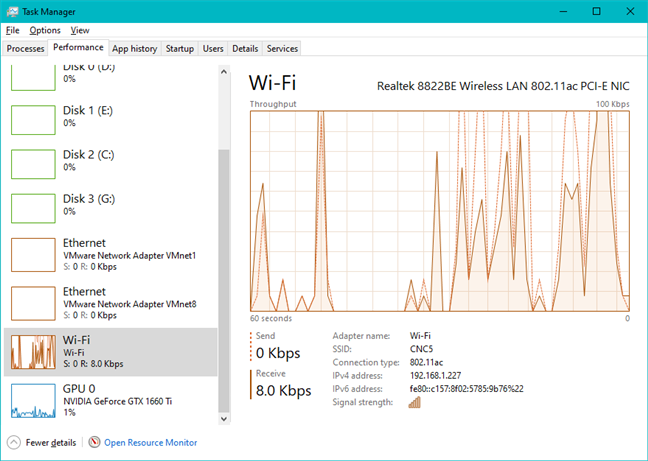
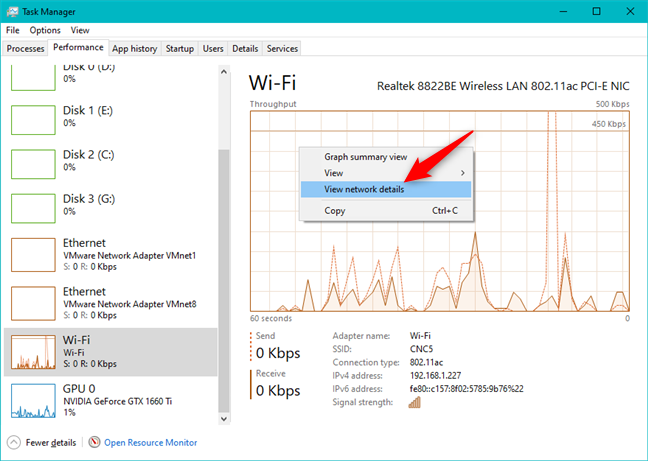
The Ethernet and Wi-Fi connections are listed separately, along with any virtual network adapters you might use for virtual machines or Bluetooth adapters. Choose the interface that you want to monitor. The graph displays the total usage for the last minute, and the chart below shows information about the data sending and receiving speeds, the connection type, and the IP address. You can also see the average send and receive speeds in the list from the left side of the window, under each network adapter.
For a greater level of details about your network usage, right-click or press-and-hold the graph and click or tap on "View network details."
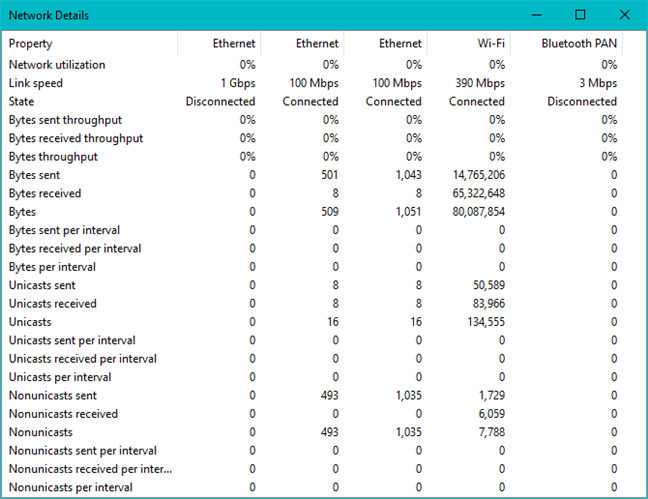
The resulting window displays tons of useful information for the discerning network technician including the total network utilization, link-state and speed, bytes sent/received and the number of unicast and non-unicast packets sent and received.
5. Task Manager allows the user to monitor the current storage utilization (HDD or SSD)
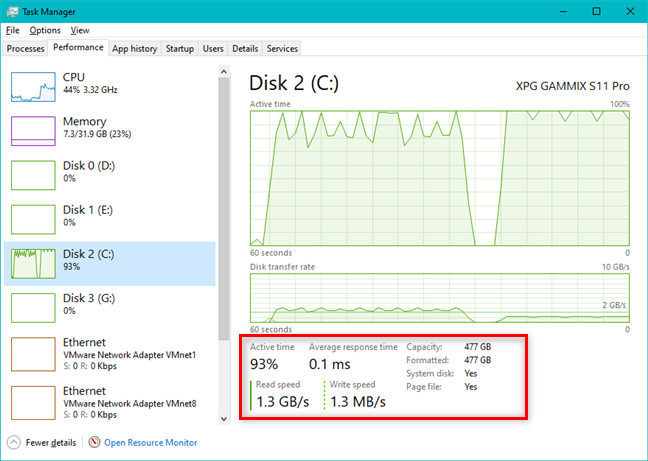
Another resource that you may want to monitor is Disk usage. You can get to it by selecting it in the list from the left of the Performance tab in Task Manager. Or, if you prefer, right-click (or press-and-hold) somewhere inside the window and go to "View -> Disk."
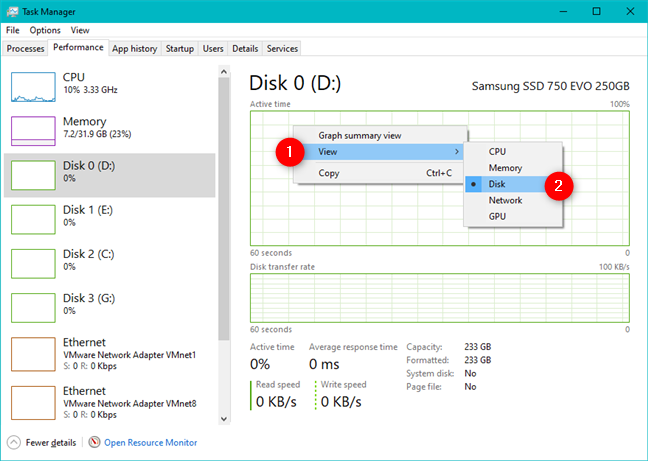
This section allows you to see the activity of your hard drives or solid-state drives. The top graph displays disk usage over the past 60 seconds, while the bottom graph displays how fast your data is getting transferred.
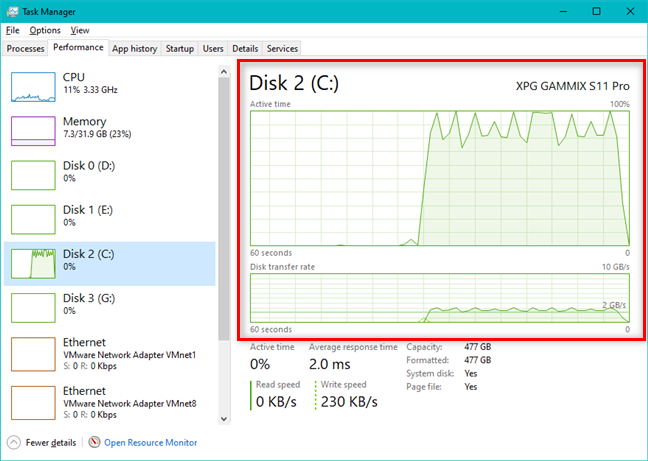
Below the graphs, there is more information, including the percentage of time your drives have been active, the average speed with which they respond to requests, the average read and write speeds and the drives' capacities.
6. View a summary of the utilization of a system resource (processor, graphics, memory, network or storage)
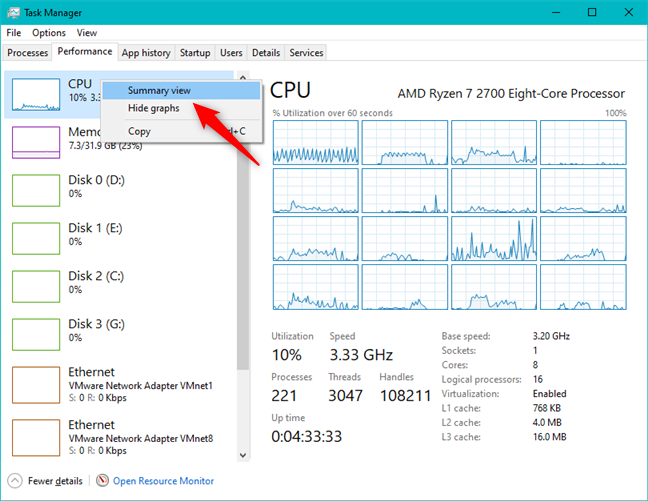
If you plan to monitor resource usage over an extended period, you may want to minimize the amount of information displayed in the Task Manager window. After all, you cannot minimize the window and watch it at the same time. To preserve screen space, the Task Manager offers a graph summary view that shows only the current charts and nothing else. To try it out, double-click (double-tap) on the graph of the system resource you want to monitor. Alternatively, you can also right-click or press-and-hold on the system resource graph and then click or tap on "Graph summary view."
The resulting window is smaller and less cluttered. This is what you get for the processor (CPU):
Also, this is what you get for a wireless card:
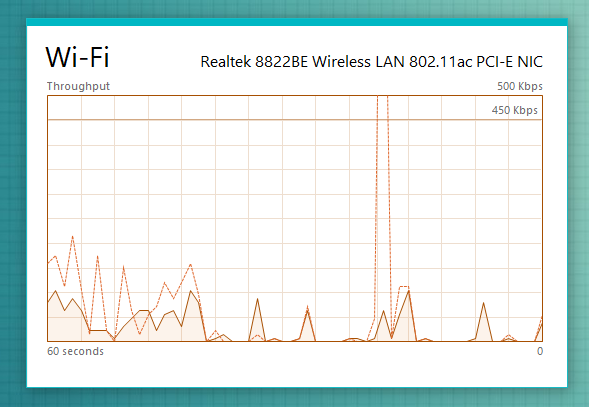
The mini-graphs you get for the other system resources are similar to the ones above.
7. View a summary of the utilization of all the essential system resources at the same time, in a single small window
If you would rather get a quick view of all your resources usage, you can right-click or press-and-hold the list of resources and click or tap "Summary View."
The Task Manager window shrinks down to show you each resource and its percentage of total usage, making it easier to monitor without taking up too much screen real estate.
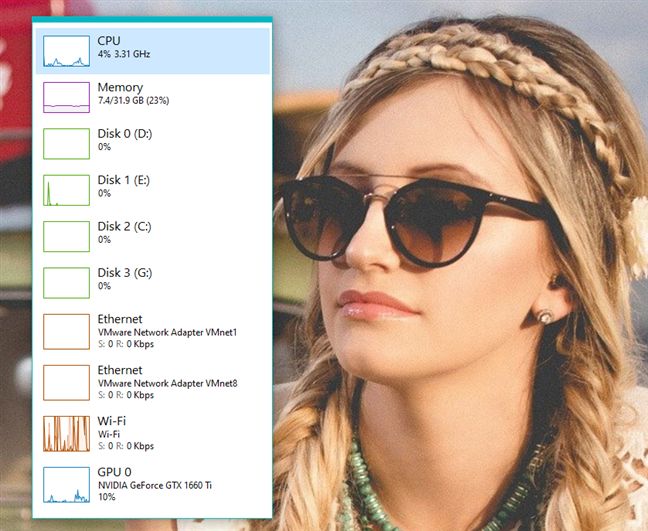
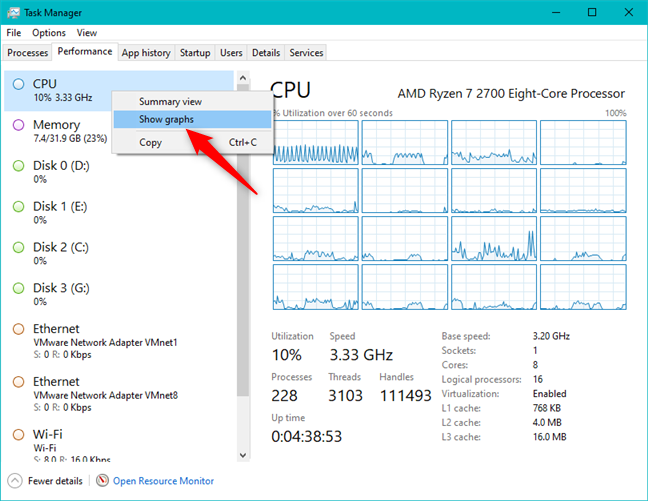
In the latest versions of Windows 10, the column from the left side of the Task Manager windows shows mini-graphs for each resource usage, by default. They're also shown in the Summary view by default. However, in older versions of Windows, you might not see them by default. If that is the case for you, right-click or press-and-hold the list and select "Show graphs" to display them.
How to copy and paste information about the use of your system resources
Now that you know how to view all that useful information about your system's resources, you may want to record some of the data. While you could take a screenshot, you would only end up with an image, which is not useful if you need to work with that information. Fortunately, you can copy and paste the data that you need. Right-click or press-and-hold on the data chart from any resource and click or tap Copy.
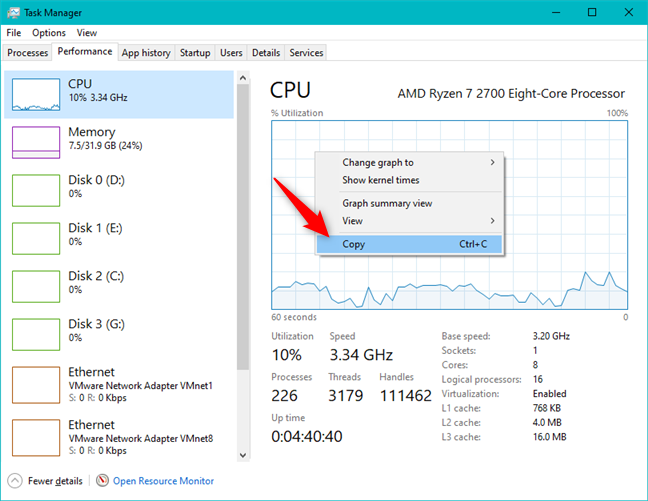
Open a word processor or spreadsheet application and paste the data for a well-formatted info dump that you can use for presentations or records.
Why did you want to check the usage of your CPU, RAM, GPU, and other system resources?
Now you know how to use the Task Manager in Windows 10 and Windows 8.1, to keep tabs on your system's performance. The data charts for each resource share plenty of information, and both techies and home users alike appreciate the data they can gather from the Performance tab of Task Manager. You know that the Task Manager is a neat tool that allows you to monitor the current CPU and memory utilization, as well as check the GPU usage, or the usage of other important resources such as your network interfaces or storage drives. If you have any questions on this subject, do not hesitate to leave a comment below.