


Checking CPU usage helps you understand why your PC slows down or why an app feels unresponsive. Windows 10 offers several built-in tools that show real-time activity, per-core load, and background processes that might push your CPU too hard.
This guide shows the fastest ways to check CPU usage and gives deeper tools for advanced monitoring.
1) Check CPU usage with Task Manager
Press Ctrl + Shift + Esc and select More details if the compact view appears. Next, choose the Performance tab. Here, you can see the live CPU percentage, clock speed, core count, and utilization history.

To see the CPU usage per app, click the Processes tab at the top and click the CPU column header to sort by highest usage. You can now look for apps or services running above normal levels.

Lastly, you can switch to a logical processor (per-core) view to see whether usage spreads evenly across the CPU. Just right-click the CPU graph and select Change graph to > Logical processors. From here, watch for cores staying maxed out while others stay idle.

2) View CPU usage with the Windows 10 Game Bar
Game Bar displays a small overlay that shows CPU usage even when apps run full-screen. To use this, press Windows + G and select Performance from the widget panel. Now, turn on CPU monitoring.
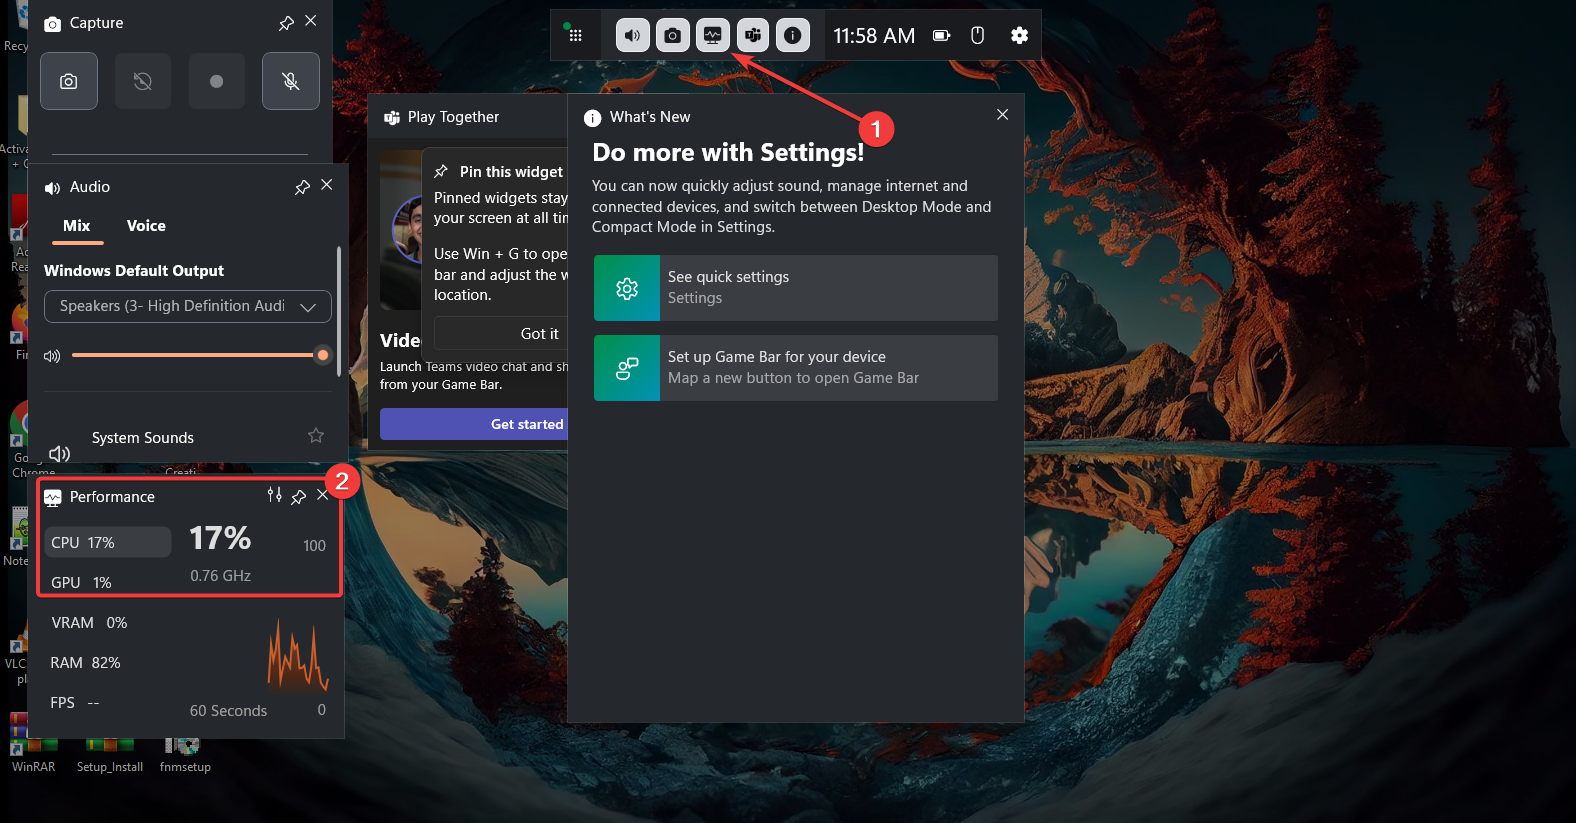
Lastly, click the Pin icon to pin the widget for real-time tracking
3) Use Resource Monitor for deeper CPU insights
Resource Monitor shows process, service, and thread-level CPU behavior. It’s more detailed than Task Manager.

To launch the Resource Monitor, press the Windows key and type Resource Monitor. Next, select CPU to view active processes and threads. From here, you can now expand each process to show services, handles, and threads. This helps you understand why a process hits the CPU.
4) Monitor CPU usage with Performance Monitor
Performance Monitor tracks CPU metrics long-term. It’s ideal for diagnosing issues that happen unpredictably.
To start the Performance Monitor tool, press the Windows key + R to open run, then type perfmon and press Enter. Next, click the + button and add counters like Processor Time, Interrupt Time, and % Privileged Time. Lastly, click OK when you are done.

Pro tip: Create a data collector set for logging. Open Data Collector Sets > User Defined, create a new set, add CPU counters, and save the log to track usage trends.
5) Check CPU usage via command line
Press the Windows key, type powershell and select the Windows PowerShell option. Next, copy and paste the command below and press Enter
Get-Counter '\Processor(_Total)\% Processor Time'You can also use the WMIC command for simple usage checks on Command Prompt. Just search cmd on Start, select Command Prompt, and run the command below:
wmic cpu get loadpercentage6) Monitor CPU usage with third-party tools
Third-party tools offer features like per-core temperature monitoring, in-game overlays, and historical charts that Windows tools lack.
Common choices include HWInfo, MSI Afterburner, and Open Hardware Monitor. These tools give deeper insight into your CPU’s real behavior under load.
7) Understand CPU usage readings
Knowing what the numbers mean helps you interpret spikes, normal load ranges, and potential issues.
Normal vs high CPU usage
Light browsing stays around 5–20%. Heavy tasks like video exporting or gaming can hit 60–100% temporarily.
What temporary spikes mean
Short spikes occur when apps launch, load web pages, or scan files. They’re normal unless constant.
When sustained high CPU points to a problem
If usage stays above 80–90% during light workloads, you may have a stuck process, background scan, or driver issue.
8) Troubleshoot high CPU usage issues
- Close heavy background apps
- Check for malware or unknown tasks
- Update drivers and Windows components
- Stop problematic startup programs
FAQs
Why is my CPU at 100%? A heavy app, stuck process, or malware scan may cause sustained high usage.
Can I monitor CPU temperature in Windows 10? Windows does not include a temperature tool, but third-party monitors can show thermal data.
Can CPU usage cause system freezes? Yes. When usage stays at 100%, apps compete for CPU time and slow down.
How do I log CPU usage over time? Use Performance Monitor’s data collector sets to generate long-term usage logs.
Summary
Task Manager offers the fastest way to view CPU usage. If you need deeper information, tools like Resource Monitor and Performance Monitor show real-time activity, per-core behavior, and long-term trends. Game Bar helps when running apps full-screen.
Conclusion
Windows 10 gives you several reliable ways to monitor CPU usage. Start with Task Manager for quick checks, then use Resource Monitor or Performance Monitor to troubleshoot heavy spikes or ongoing slowdowns. With these tools, you can identify issues faster and keep your system running smoothly.


Discussion (0)
Be the first to comment.