



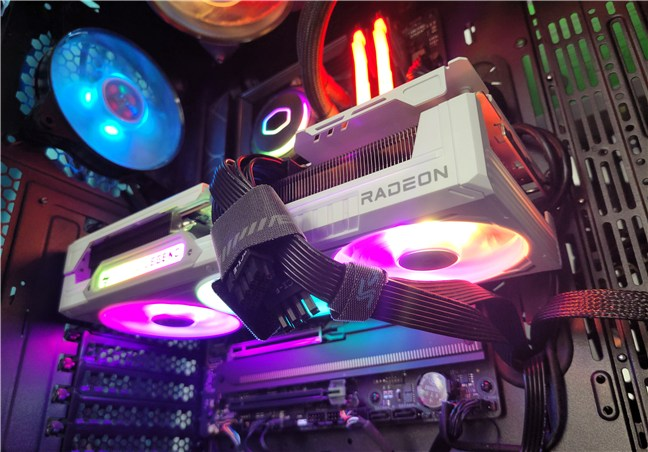
If you want to test GPU health on Windows, you can use built-in system tools and specialized software to check the performance, temperature, and stability of your graphics card. Regular GPU health checks help detect overheating, performance issues, or hardware failures before they become serious problems.
Testing GPU health is useful for gamers, content creators, and anyone who relies on graphics performance. This guide explains several easy ways to test the health of your GPU.
Why Testing GPU Health Is Important
Your graphics processing unit (GPU) is responsible for rendering graphics, running games, and handling visual workloads. Over time, GPUs may experience performance degradation or hardware problems.
Testing GPU health can help you:
- Detect overheating issues
- Identify performance problems
- Monitor GPU usage and temperature
- Check for driver-related errors
- Ensure the GPU is functioning properly
Regular monitoring helps keep your system stable.
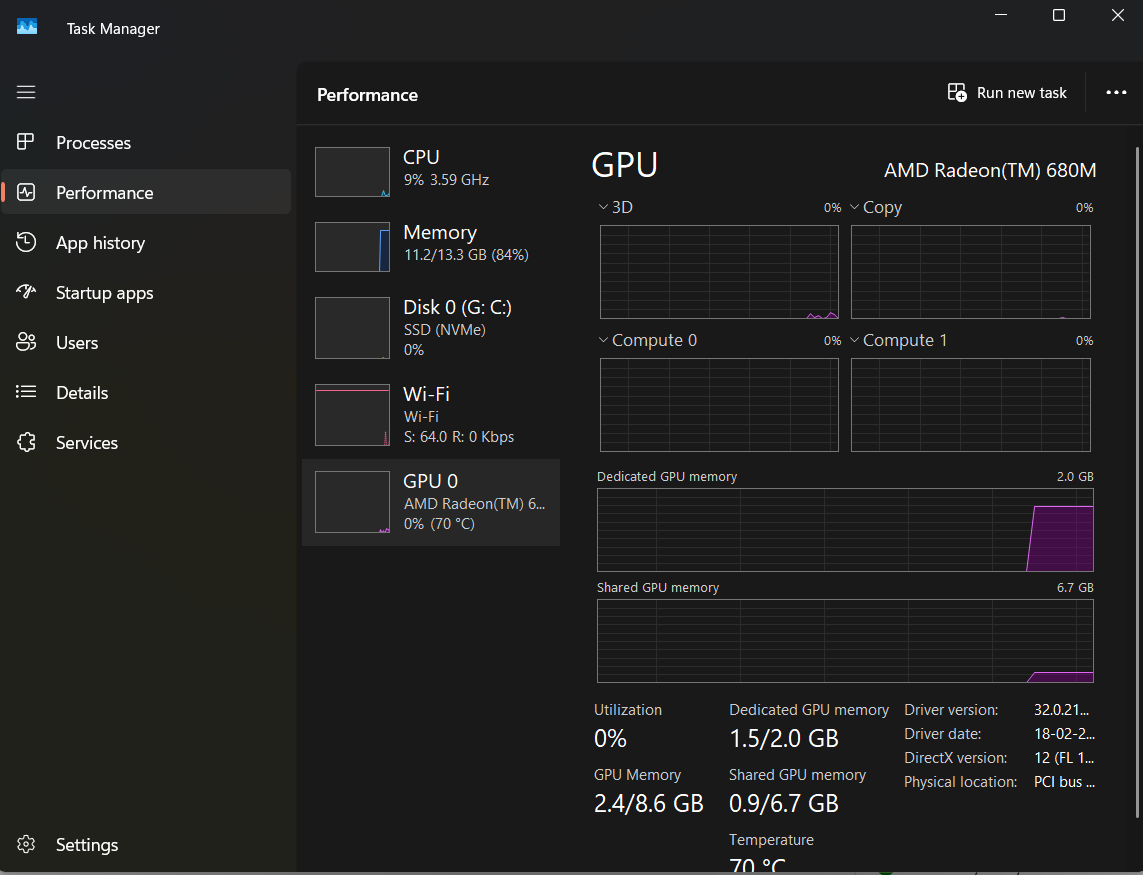
Check GPU Health Using Task Manager
Windows includes built-in tools that allow you to monitor GPU activity.
Step 1: Open Task Manager
- Press Ctrl + Shift + Esc.
- Open Task Manager.
Step 2: Go to the Performance Tab
- Click Performance.
- Select GPU from the list.
This section displays:
- GPU utilization
- GPU memory usage
- Temperature (on supported systems)
These metrics help identify abnormal behavior.
Use GPU Monitoring Software
Dedicated monitoring tools provide detailed GPU information.
Popular GPU monitoring tools include:
- MSI Afterburner
- GPU-Z
- HWMonitor
- HWiNFO
These tools display real-time information such as temperature, clock speeds, voltage, and GPU usage.
Run GPU Stress Tests
Stress tests push the GPU to its limits to check stability and performance.
Common GPU stress test tools include:
- FurMark
- 3DMark
- Unigine Heaven Benchmark
During stress testing, monitor:
- Temperature levels
- Performance stability
- System crashes or artifacts
If the GPU fails under stress, it may indicate hardware problems.
Check GPU Temperature
Overheating is one of the most common GPU problems.
Most GPUs should operate within safe temperature ranges:
- Idle temperature: 30–50°C
- Gaming or heavy load: 60–85°C
If temperatures exceed safe levels, you may need to improve cooling or clean dust from the system.
Look for Visual Artifacts
GPU issues sometimes appear as graphical glitches.
Signs of GPU problems include:
- Screen flickering
- Random colored pixels
- Distorted graphics
- Game crashes
These artifacts may indicate overheating, driver issues, or hardware failure.
Update GPU Drivers
Outdated drivers can cause performance problems.
To update drivers:
- Open Device Manager.
- Expand Display adapters.
- Right-click your GPU.
- Select Update driver.
You can also download drivers directly from the GPU manufacturer’s website.
Run Windows Hardware Diagnostics
Windows includes a built-in tool to test hardware stability.
Steps:
- Press Windows + R.
- Type mdsched.exe and press Enter.
- Restart your computer to begin the diagnostic test.
While primarily used for RAM, it can help detect system stability issues affecting the GPU.
Final Thoughts
Knowing how to test GPU health on Windows can help prevent serious hardware issues and ensure your system performs at its best. Monitoring temperatures, running stress tests, and using diagnostic tools can reveal problems early.
By regularly checking your GPU health and keeping drivers updated, you can maintain stable graphics performance for gaming, design, and other demanding tasks.
FAQs
How can I check GPU health on Windows?
You can monitor GPU performance using Task Manager, stress testing tools, or dedicated monitoring software.
What temperature is safe for a GPU?
Most GPUs operate safely between 60°C and 85°C under load.
What are signs of a failing GPU?
Common signs include crashes, graphical artifacts, overheating, and performance drops.
Do GPU stress tests damage the GPU?
No. Stress tests simulate heavy workloads but should be monitored to avoid excessive temperatures.
Discussion (0)
Be the first to comment.