




A speed test tells you one thing: how much data your connection can move at a single moment in time. It tells you nothing about whether your connection is stable, whether packets are being dropped, or where in the chain between your PC and the internet the problem actually lives.
This matters because most internet problems people experience, stuttering video calls, game lag spikes, websites that occasionally time out, are not caused by low speed. They are caused by instability. Diagnosing instability requires different tools, and Windows has three of them built in.
What You Are Actually Diagnosing
Before running any commands, understanding three terms makes the results immediately useful rather than confusing.
Latency is the time in milliseconds for data to travel from your PC to a destination and back. Under 20ms to nearby servers is excellent. Under 50ms is comfortable for everything. Above 100ms starts to feel sluggish in real-time applications.
Jitter is how much your latency varies. A stable 45ms feels smooth. A connection swinging between 20ms and 150ms randomly feels broken even though the average looks acceptable. High jitter causes choppy video calls and stuttering games.
Packet loss is when data sent over the network never arrives. Even one percent packet loss causes audible dropouts in calls and visible hitching in games. Any consistent packet loss is a problem worth investigating.
Tool 1: Ping for Continuous Latency Monitoring
Ping sends small test packets to a destination and measures how long each one takes to return. Running it continuously reveals both your latency and whether packets are being lost.
Open Command Prompt by pressing Windows and R, typing cmd, and pressing Enter. Then type:
ping -t 8.8.8.8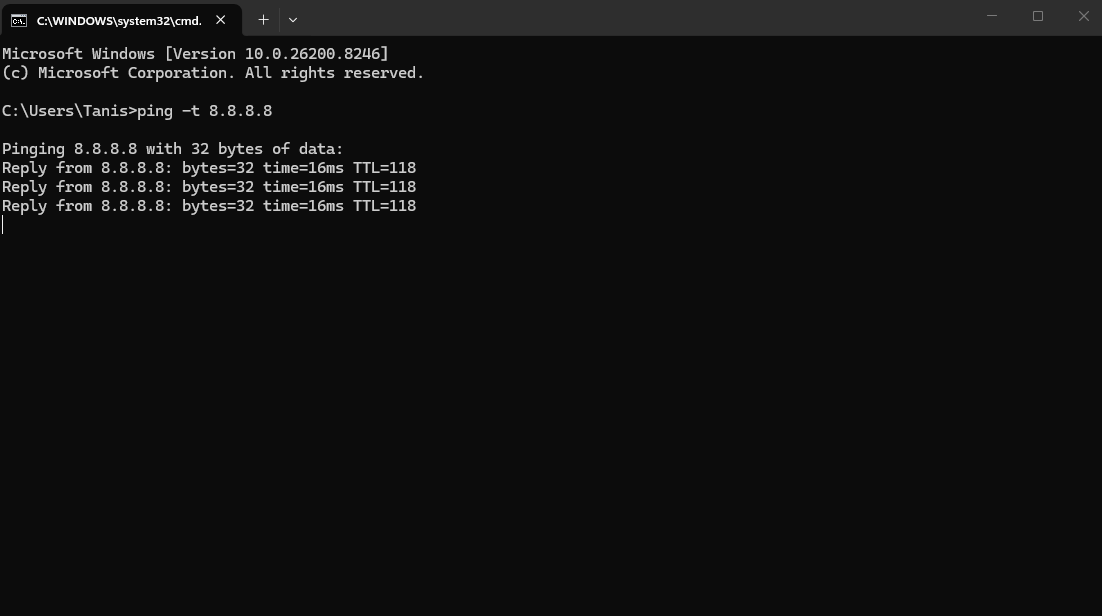
The -t flag keeps ping running until you stop it. 8.8.8.8 is Google's DNS server, which is reliable and responds quickly from most locations.
Let it run for at least three to five minutes, then press Ctrl and C to stop it. The summary at the bottom shows minimum, maximum, and average round trip time, plus packet loss percentage.
A healthy result looks like this, with times staying close together:
Reply from 8.8.8.8: time=14ms
Reply from 8.8.8.8: time=15ms
Reply from 8.8.8.8: time=13ms
A problematic result looks like this:
Reply from 8.8.8.8: time=14ms
Reply from 8.8.8.8: time=287ms
Request timed out.
Reply from 8.8.8.8: time=15ms
That 287ms spike and the timed out line confirm instability somewhere between your PC and Google. The question is where, and that is where the next tool comes in.
Start with your router first. Find your router's IP address by typing ipconfig in Command Prompt and noting the Default Gateway address, usually 192.168.1.1. Ping that address first. If your router shows spikes or timeouts, the problem is inside your home network. If your router responds cleanly but 8.8.8.8 shows problems, the issue is further upstream.
Tool 2: Tracert to Find the Broken Hop
Ping confirms a problem exists. Tracert shows you exactly where it starts.
In Command Prompt, type:
tracert 8.8.8.8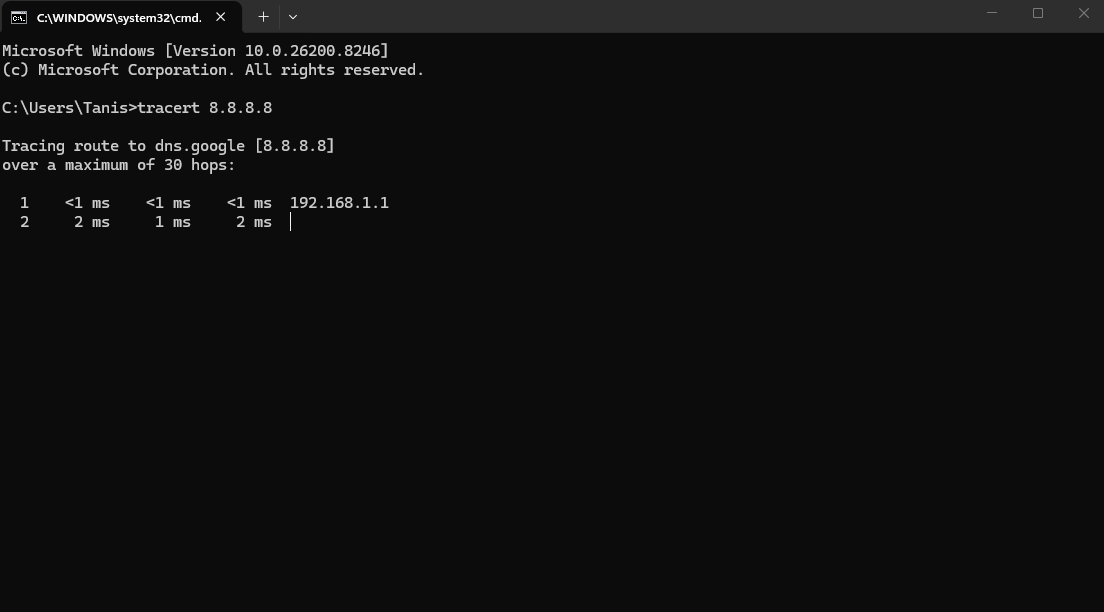
Tracert maps every router between your PC and the destination, measuring latency at each one. The output looks like this:
 1     1 ms     1 ms     1 ms  192.168.1.1
 2     6 ms     5 ms     6 ms  10.0.0.1
 3    12 ms    11 ms    13 ms  isp-core-router.net
 4   250 ms   248 ms   251 ms  backbone-node.net
 5   251 ms   250 ms   252 ms  8.8.8.8
Read each line as a hop. The number on the left is the hop number. The three time values are three separate test packets. The address on the right identifies the router at that hop.
In this example, hops 1 through 3 show healthy low latency. Hop 4 jumps to 250ms and stays elevated through hop 5. This is the signature of a problem starting at hop 4, which belongs to a backbone network between the ISP and Google. Everything before it was fine.
What the asterisks mean. Many routers display asterisks instead of times:
3 * * * Request timed out.This usually means the router at that hop is ignoring tracert probes rather than responding to them. It is not necessarily a problem. If the hops after the asterisks show normal latency, the data is flowing through fine and the router is simply configured not to respond to diagnostic traffic.
Asterisks only indicate a genuine problem when they appear at the final hop you cannot reach, or when all hops after a certain point show asterisks alongside the latency spikes you confirmed with ping.
Tool 3: PathPing for a Combined View Over Time
PathPing is the least-known of the three tools but often the most useful for diagnosing intermittent problems. It combines ping and tracert into a single test that runs continuously for several minutes, accumulating statistics at every hop.
In Command Prompt, type:
pathping 8.8.8.8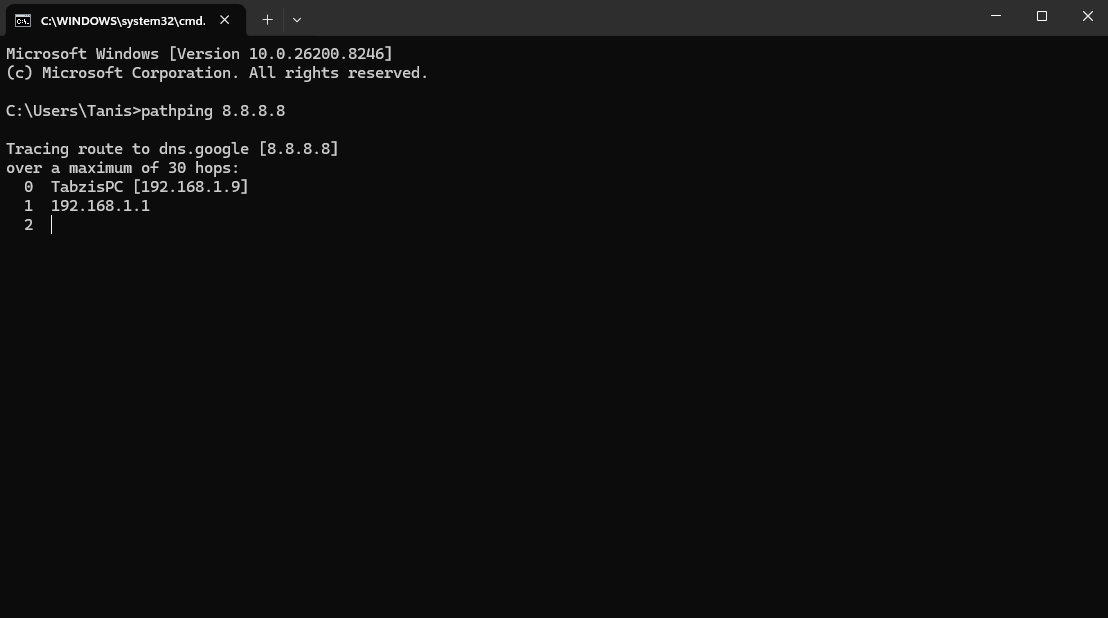
PathPing first maps the route as tracert does, then spends around 25 seconds sending packets to every hop simultaneously and collecting the results. The final output shows packet loss percentage and average latency at each individual hop.
The output looks like this:
Hop  RTT  Lost/Sent  Pct  Address
  0                        192.168.1.1
  1    1ms   0/100    0%   10.0.0.1
  2   12ms   0/100    0%   isp-router.net
  3   13ms   8/100    8%   backbone-node.net
  4   14ms   0/100    0%   8.8.8.8
Hop 3 shows eight percent packet loss while hop 4 shows none. This pattern, where loss appears at one hop but the next hop shows recovery, usually indicates the intermediate router is deprioritising pathping packets rather than genuinely losing them. Genuine packet loss appears at a hop and persists through all subsequent hops.
When packet loss appears at a hop and stays at that percentage or higher through every hop after it, that is the real problem location. Note the address at that hop, search it at who.is to identify which company operates it, and you know whether the problem is in your home network, your ISP's infrastructure, or a backbone network further along the route.
Reading the Results: Whose Problem Is It
Once you have identified the hop where instability begins, the question is what you can do about it.
Hop 1 is your router. Spikes or packet loss here means the problem is inside your home. Restart the router, check cables, and test whether the issue exists on both wired and wireless connections. If wireless shows problems but wired does not, the issue is your Wi-Fi. If both show the same problem, the router or its cables are the likely cause.
Hops 2 and 3 belong to your ISP. Consistent problems starting here that persist through all later hops are your ISP's responsibility to investigate. Take your PathPing output showing the specific hop with packet loss and the percentage, and include it in a support ticket or call. Specific data gets faster action than a general complaint.
Later hops belong to backbone networks or the destination. Problems starting at hop 5 or beyond are outside your ISP's direct control. These are congestion or routing issues in the broader internet infrastructure. They often resolve on their own as routing tables update or congestion clears. If the same problem occurs consistently at the same hop to the same destination over several days, it is worth reporting to your ISP as they sometimes have routing agreements that allow them to escalate.
Frequently Asked Questions
How long should I run ping before the results are meaningful?
At least three to five minutes for a general stability check. For intermittent problems that only appear occasionally, run it in the background for thirty minutes to an hour during the time of day when you normally experience the issue. The longer the test, the more representative the results. A five-second ping test that looks clean tells you nothing about what happens during a forty-minute gaming session.
Can I save the results to share with my ISP?
Yes. Run the command with output redirected to a text file. For example: pathping 8.8.8.8 > results.txt saves the output to a file in your current directory. You can then attach this file to a support ticket, which gives ISP support staff specific, actionable data to work with rather than a verbal description of the problem.
Why does tracert show high latency at one hop but lower at the next?
This is common and usually not a problem. Some routers process forwarded traffic at high priority but respond to diagnostic probes like tracert at low priority. A router showing 80ms while the next hop shows 15ms is almost certainly prioritising probe responses lower than actual traffic. If the final destination responds with low latency, the intermediate high reading is not causing your problem.



Discussion (0)
Be the first to comment.