We've all been through the Christmas holidays, and are thinking of ways to compensate for the sudden change in lifestyle for 2 weeks. Everyone seems to be worried about the weight put on during the holidays, so I decided to have the first quantified Christmas and New Year. After getting the data from paying attention to my activity, sleep and food, I have drawn some very interesting conclusions. In this article, I will share with you the data from December 2014, compared to the rest of the year. The surprising insight is that the holidays are, in fact, not that significant compared to the rest of the year when looking at the actual data. Here's what I have learned:
What Was I Tracking?
Because I knew I was moving to a new apartment in December, I chose to restrict myself to several types of metrics that were already easy to track for me:
Food-related metrics: I keep a detailed food log, that focuses on the main macronutrients - carbs, proteins, fibers, and fat - in addition to calories
Sleep-related metrics: sleep quality (as measured by my BodyMedia Link armband), sleep duration and time to fall asleep
Activity-related metrics, as reported by my BodyMedia Link armband (number of steps, calories burned)
Weight measurement during the morning and evening
Note that there is an error in tracking everything. From the weight (the scale might have an error), to estimating the food quantities and the measurement of the BodyMedia Link sensor. However, that only implies that the data is not correlated correctly in some situations, as you will see in this case study. Despite all errors, interesting conclusions can still be drawn.
Preliminary Conclusions
My main conclusion is that the lifestyle in December is mostly the same lifestyle that I have during the rest of the year, exacerbated a bit (10-15%) by the holidays. So if you gain weight, it's because you are maintaining the unhealthy lifestyle from the rest of the year and only amplifying it: eating a bit more, sleeping a bit more, moving a bit less. But most of us only tend to pay attention to our weight during this period, so a false impression that the problem lies in the holidays is created.
I tracked my own weight during this period, and even though there was literally no limit on what I ate, I only gained 1 kg (2 lbs) during the holidays, which is slowly coming off now. That is unbelievable at first sight - are holidays only 10% worse than the rest of the year? Looking at the data, it is true.
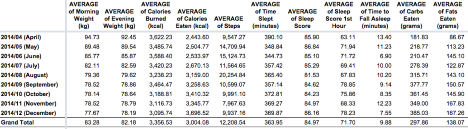
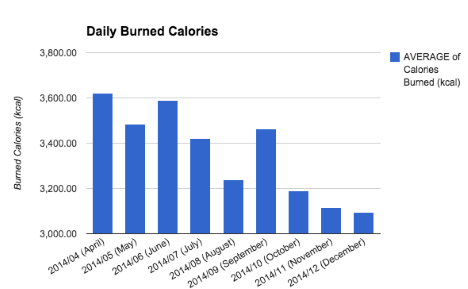
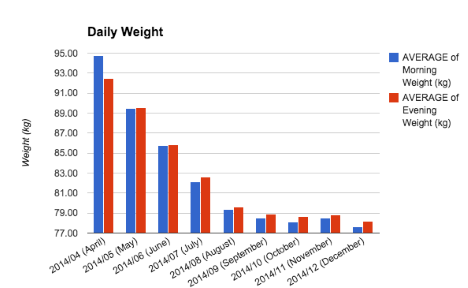
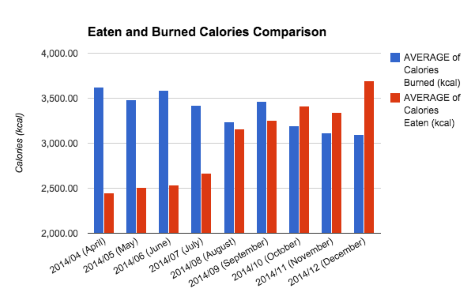
Here is the aggregated data for the last 9 months of 2014. Notice how the weight is still trending down slowly, despite the fact that my calories burned are below calories eaten. That is because I have been over-estimating food more aggressively lately (will have to stop that). I also started drinking more water, while eating less sodium, making the total quantity of water in my body decrease.
Christmas, habits, food, sleep, activity
Small changes in the data sometimes reflect huge changes in life. Now, let's go through the individual categories of metrics mentioned before (food, sleep, activity, weight) in order to see how they varied throughout the holiday season.
I considered the whole month of December as the holiday season. I chose the whole month because the first half is usually busier in order to make arrangements for the second half. So the whole month is a disruption from our normal routine.
Food
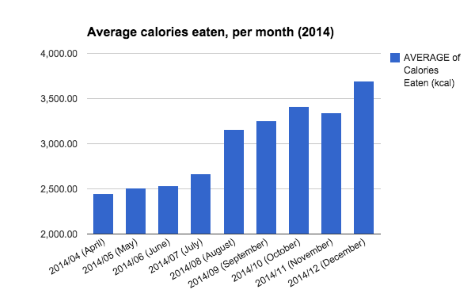
My first reaction when seeing the data was: "It wasn't that bad!". My average calorie intake for December was about 3700 kcal per day, compared to the 3330 kcal per day average for the past 3 months (September-November). Interestingly enough, that is an 11% increase! In absolute numbers, it's quite significant, of course.
Christmas, habits, food, sleep, activity
If you're wondering why I'm eating so many calories, it's because I also burn a lot (as measured by the BodyMedia Link). My current weight goal is to lose about 1 kg (2 lbs) per month for the next 3 months, so I will pay more attention. During the last months, I've over-estimated my food intake more aggressively than usual, so the actual numbers are not that high to begin with.
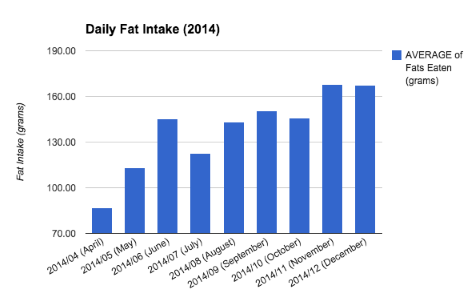
Leaving calories aside, the other food metrics look pretty good. I've been having a problem with fat intake since May 2014, as my fat intake has been somewhere between 40% and 45% of the calorie intake. This is bad, and leads to increased heart disease risk on the longer term, I know. This is because of the following changes:
I practice intermittent fasting (eating only breakfast and lunch); this means that I am eating foods that are denser in calories. Those tend to contain more fat.
I gave up meat (except for fish meat) sometime in June 2014; the reason is because I do not trust that you can find a reliable, constant source of healthy meat. This further complicates my fat intake, as I am struggling to find a low-fat way to bring enough proteins into my diet. They are required for tissue growth, and I am currently taking them from vegetables and cheese.
I started eating one avocado per day (well, almost - about 200 in the past 9 months). It contains quite a lot of unsaturated fat. Even though it is believed to lower heart disease risk, the overall metric is still quite problematic.
Christmas, habits, food, sleep, activity
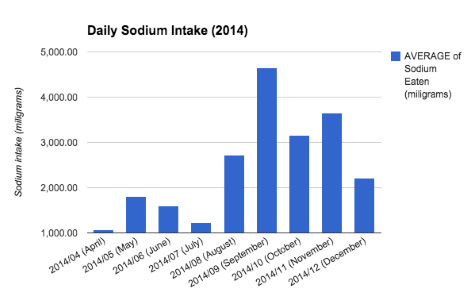
But the good thing is, fat intake during December wasn't worse than the usual. Another thing that I had been closely monitoring since November 2014 was sodium intake. You see, I had been eating salty foods for months without paying too much attention. Too much sodium leads to increased risk of cardiovascular disease:
Wasa fiber-rich crispbread in order to help keep my fiber intake high. But I never considered checking the salt as well.
Olive Oil Pretzels in order to halt my weight loss with its calories by introducing a healthy snack (or so I thought).
Christmas, habits, food, sleep, activity
I eliminated both from my diet in December 2014, and you can see that even though I was feasting on certain days (my personal record being 7000 kcal eaten in the Christmas day), the monthly sodium average is much better.
Since my wife and I are both not eating meat anymore except fish, we have to be very careful about our protein intake. Happily for us, our moms took notice of that when we visited our families for the holidays, and the big meals we took part in were rich in fish meat. So in December, I had a 13.26% average intake from proteins, highest ever since I quit eating other types of meats.
For me, logging a feast makes me feel more relaxed and enjoy it more. This is a bit counterintuitive, but the reason is that I know I can now evaluate my excess and compare it to what happens to the rest of the year.
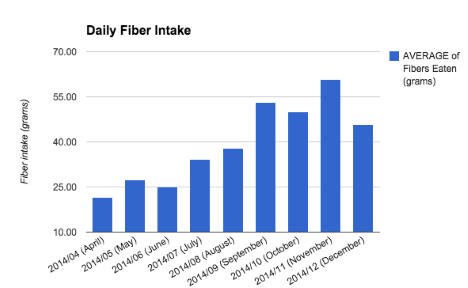
Finally, even though holiday food is mostly cooked and lacks fiber, I still managed to pull of a 45 grams per day of fiber average in December. Despite the fact that I stopped eating the Wasa Crispbread.
Christmas, habits, food, sleep, activity
Sleep
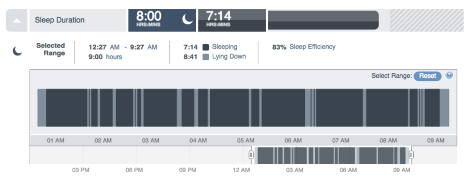
The two sleep metrics that I closely follow are: Sleep Score (0-100, the higher the better) and Time to Fall Asleep. I measure both by wearing my BodyMedia Link with me to bed. The Sleep Score is the ratio between the time it you were sleeping (according to the sensor), and the time spent in bed. One night's data might look like this:
Christmas, habits, food, sleep, activity
While it's easy to understand why I use the sleep score, Time to Fall Asleep is important to me because I am a hyperactive person with problems falling asleep. To improve that, I employ a number of different tricks: read before bedtime from my Kindle without my glasses on (to make my eyes tired), sleep on an empty stomach so that I have less energy during the evening (intermittent fasting), avoid coffee altogether. Over time, it has proven a very good measure of how well I am doing.
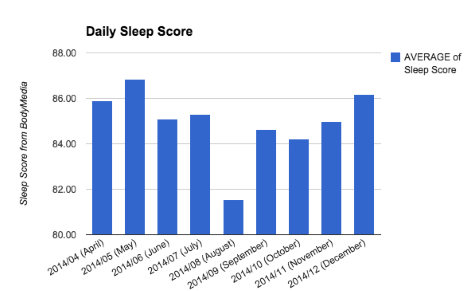
During December 2014, my Sleep Score average was back up to 86%, a stellar performance I had not achieved since the beginning of summer, when I was walking daily plenty of miles per day in fresh air and relaxing more. The score was good despite the stress associated with searching for a new apartment and moving all the things into it (we filled a generous van with them).
Christmas, habits, food, sleep, activity
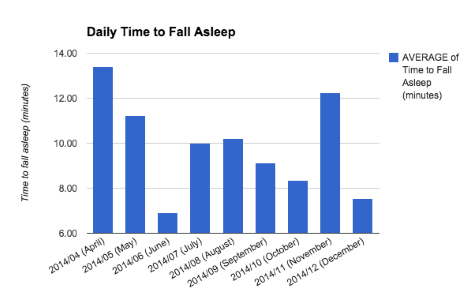
The Time to Fall Asleep was at an all-time low. Basically, whenever I had time to hit the bed, I would fall asleep immediately. I did not have energy to read from my Kindle at all, which was a good sign but it got me thinking about my precious books and changing my reading routine.
Christmas, habits, food, sleep, activity
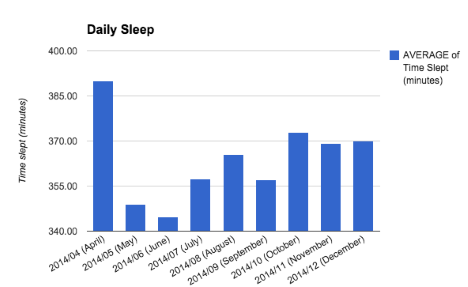
Slept minutes were about the same as the last 2 months (October and November) - 370 minutes. This was significantly higher than September (which had 357). In September I started working on Programmer Fitness, and I did not know how to organize my time yet. This led to a lot of late nights, and at the end of the month, I decided to get a bit more sleep and a more regular schedule.
My sleep score is usually 85%, which means I spend 7 hours in bed, and sleep 6 of them. That is an average which includes weekends and holidays. If it sounds like a low value, please know that I tried to increase it, but wasn't convinced about the results.
Christmas, habits, food, sleep, activity
Activity
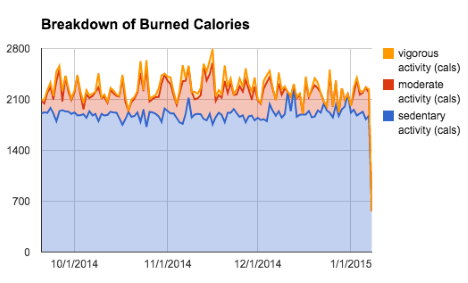
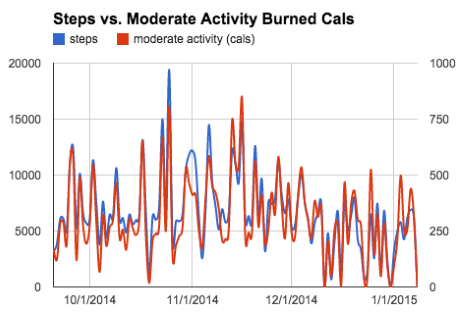
While working on Programmer Fitness, I noticed that the only meaningful amount of burned calories an average person can control is proportional to the number of steps we make. Below are two graphs from an actual client to prove that. The first is the breakdown of burned calories into the Basal Metabolic Rate, Moderate Activity and Intense Activity (adding up to the total number of burned calories).
Christmas, habits, food, sleep, activity
The second one is the scary correlation of Moderate Activity with the number of steps.
Christmas, habits, food, sleep, activity
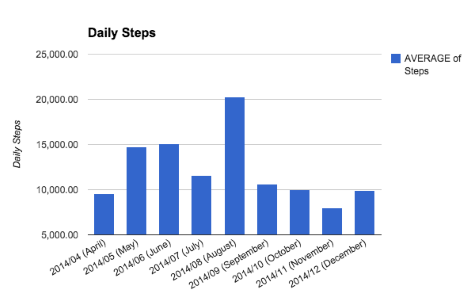
That makes me care about the number of my steps more than you'd expect. And surprise: the number of steps I made in December were not the lowest of 2014. It can be explained quite simply:
We had to move to a new apartment this month. This meant viewing 15-20 apartments before choosing the one we moved in. That required a lot of driving and walking.
The new apartment is substantially bigger than the older one. My wife was joking that we will get a larger number of steps in the new one.
Actually moving our things also required a lot of movement.
Christmas, habits, food, sleep, activity
This is how I managed to achieve the recommended 10k per day limit, despite the busy December with freezing temperatures outside. Good news!
In terms of burned calories, there is a slight decrease compared to the previous months. We had a 2-week pause in our Qwan Ki Do trainings, and I did not have time to compensate for that on my own. Things are back to normal in January though!
Christmas, habits, food, sleep, activity
Weight
I intentionally left the weight at the end for 2 reasons: first, it's because I did not quantify myself during the holidays in order to manage my weight. I was also over-estimating the intake too aggressively. I knew it in my heart already, but seeing the data convinced me to change my behaviour.
Christmas, habits, food, sleep, activity
My total intake is higher than my total calories burned, but I still lost a bit of weight.
Christmas, habits, food, sleep, activity
There are 2 reasons for this:
I stopped eating the Wasa Crispbread and the pretzels, which were rich in sodium. So I started to eliminate a bit more water, which was being held in my body.
The aggressive over-estimation. Even an extra 10% is important on the long term.
I will try to be more mindful of my logging from now on.
What I Have Learned This December
I am so glad I did this. I never imagined the data would be so rich. My main conclusion is that even though our behaviour differs quite a lot in December, the overall differences in what we eat, how we sleep and how much we move are small. In the big picture, of course.
You don't grow fat because of the Christmas holidays, but due to your existing lifestyle. As I mentioned, we tend to pay closer attention to our weight during this time, and that is when we notice what had been happening during the year.
On the quantifying front, I will over-estimate food more conservatively. 9 months seems like a lot of data at first sight, but I quickly realised you need more.
One metric that I would have liked to see is water intake. I started to log it recently, but I'm not very good at it yet. I've noticed that when feasting, we simultaneously eat more and drink less. There is a theory that most of the time our feeling of hunger is in fact thirst, but we cannot correctly distinguish between them.
I would like to end this article by wishing you a Happy Quantified New Year! May all your metrics rise to the challenge in 2015.
Andrei Ismail is an experienced software engineer with startup experience under his belt and a PhD in Artificial Intelligence. He has lost 50 pounds in 6 months and is currently working on a fitness coaching program for geeks, available at WEIGHT LOSS FOR ENGINEERS.














Discussion (0)
Comments are closed.